
DATA VISUALIZATION
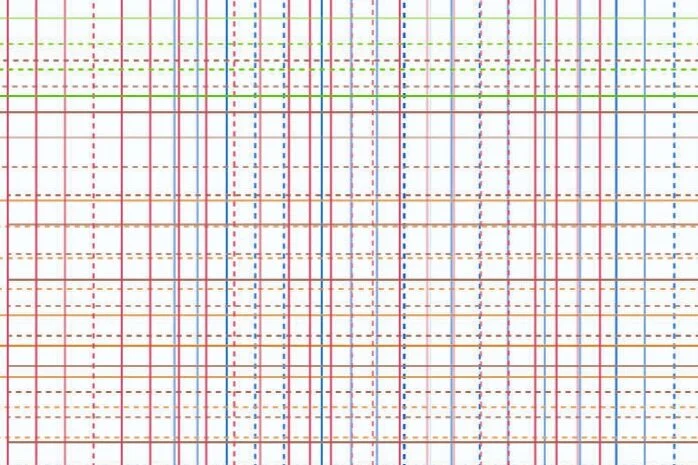
This project was inspired by the humanistic information designer, Giorgia Lupi. I started this project by ranking and defining values that I find important to my every day life. I then decided how I could tangibly track these rather intangible philosophies, which are stated in the key below. I tracked each of the five values for three consecutive days. This project was both internal and external in that I tracked my own actions as well as observed everyone else around me. After collecting all my data in an Excel document, I assigned design properties to each of the data types. For example, each value is assigned a different color, while the line quality tells if it was a personal experience or observed. Visually, my goal was to create an 11x17in poster that emulates loom weaving patterns while avoiding iconography.
